Memory Management
T-Sketch is purposefully built with web technologies to run on the widest range of devices — Windows, macOS, iPadOS, ChromeOS, Linux, and Android — without requiring separate native installations. This also makes real-time collaboration possible: everyone draws on the same canvas using just a browser.
A web application is a powerful tool, but memory is a real constraint. Browsers only give each tab a portion of your device's RAM, and that portion varies by device and operating system. A drawing app needs memory for textures, cached strokes, the WASM rendering engine, and geometry buffers. To track memory efficiently and give you control, we built the Memory Management dialog.
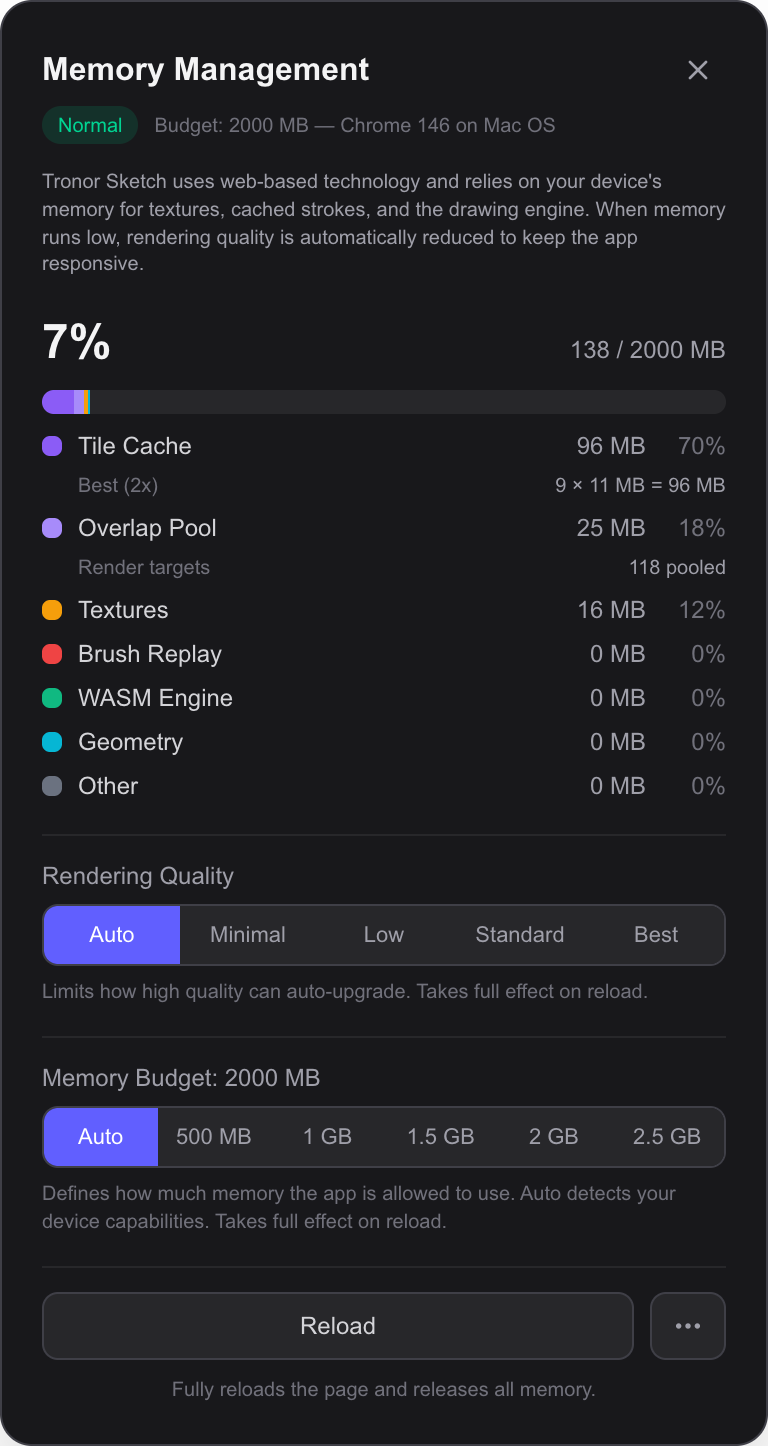
Memory usage breakdown, rendering quality, and budget controls
Opening the Dialog
Open the Memory Management dialog from the Help menu (the ? button in the bottom-right corner) and select Memory Management.
When memory usage is elevated, a colored pill appears in the bottom-right corner showing the current usage percentage. Click it to open the dialog directly.
Pressure Levels
The dialog shows a pressure level badge that reflects the current memory state:
- Normal (green) — usage is within safe limits
- Warning (amber) — usage has passed 75% of the budget. Rendering quality may be automatically reduced.
- Critical (red) — usage has passed 90% of the budget. Quality is aggressively reduced to prevent the browser from running out of memory.
When memory pressure rises, T-Sketch automatically lowers rendering quality to keep the app responsive. Quality returns to normal when memory is freed.
Memory Breakdown
A stacked bar and a per-category table show where memory is being used:
- Tile Cache — pre-rendered canvas tiles at different quality levels. This is typically the largest category. The row expands to show how many tiles exist at each quality tier and their individual size.
- Overlap Pool — pooled WebGL render targets used for ink stroke overlap processing
- Textures — image textures, symbol textures, and other GPU assets
- Brush Replay — cached raster brush stroke data for replay and re-rendering
- WASM Engine — memory used by the C++ ink rendering engine compiled to WebAssembly
- Geometry — vertex buffers and geometry data for the 3D scene
- Other — anything not covered by the categories above
Each category shows its size in MB and its share of total used memory as a percentage.
Rendering Quality
Control the maximum rendering quality tier:
- Auto (default) — the app dynamically adjusts quality based on available memory. Quality scales up when memory is plentiful and scales down under pressure.
- Fixed tier — lock quality to a specific level. Useful on low-memory devices where you want predictable performance.
Changes take full effect after a page reload.
Memory Budget
The memory budget defines how much memory the app is allowed to use:
- Auto (default) — detects your device capabilities and sets an appropriate budget. The dialog shows the detected device name and the auto-calculated budget in MB.
- Fixed value — override with a specific MB limit. Useful if you want to reserve more memory for other applications, or if you know your device can handle more.
Changes take full effect after a page reload.
Reload
The Reload button fully reloads the page and releases all memory. This is the most effective way to recover from high memory usage. Your work is saved automatically before the reload.
Related
- System Requirements — device and browser support
- Scene — navigate and manage the canvas